|
Introduction
About the Project
Comments and Feedback |
Source: 74th Congress, Senate, Department of the Interior and Related Agencies Appropriations, FY75, Part 3
Salt River Indian Irrigation Project Expansion
Statement of Paul J. Smith, Salt River Pima-Maricopa Community Council, Arizona: Department of the Interior and Related Agencies
Appropriations, FY75, Part 3
Agricultural Development
Senator Stevens. Mr. Smith, Salt River Pima-Maricopa Indian Community Council.
Mr. Smith. Mr. Chairman, I am Paul Smith, President of the Salt River Pima-Maricopa Indian Community, Arizona. The community
and heirs of allottees share approximately 50,000 acres, 30,000 of which are suspectible to agricultural development approximately
15,000 of which are developed.
Our community is surrounded by the urban Phoenix, Mesa, Scottsdale, Tempe, and Fountain Hills market of over one million persons.
We have fertile soils, dependable water rights, and a readily available labor force. In 1973 half of the top six sugar beet
fields in Maricopa County were grown on our land. We grew 500 to 600 cartons of lettuce per acre, spring and fall, averaged
two bales of cotton, 3,000 to 7,000 pounds of grain, 5.6 tons of alfalfa and grew as high as 40 tons of ensilage per acre.
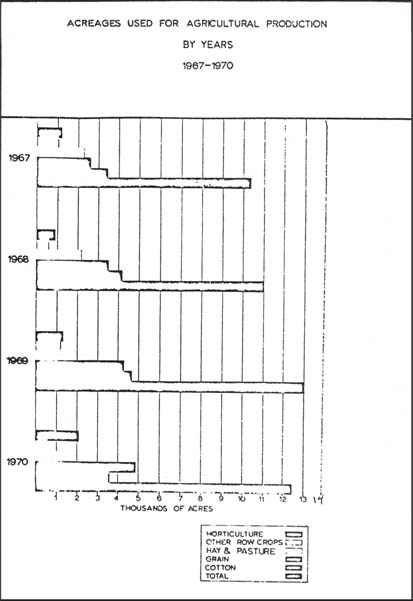
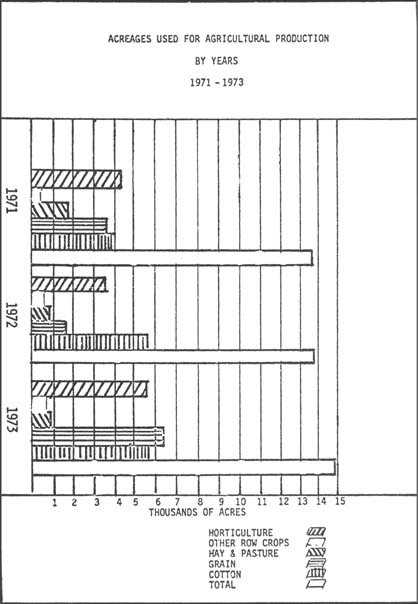
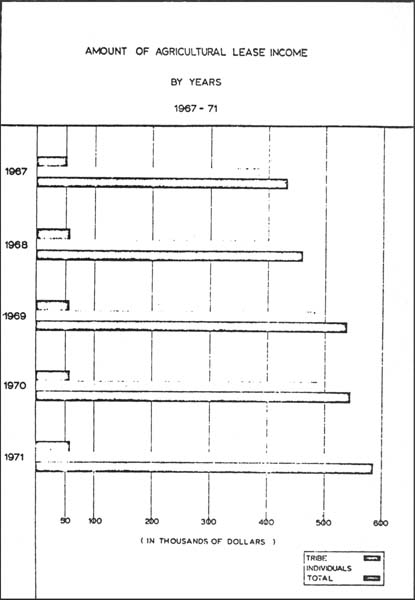
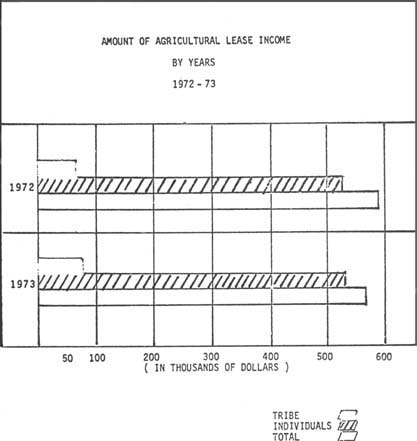
We submit 1971, 1972, and 1973 crop reports for your review as well as a bar graph on 1967–73 production value.
We Pimas have always been agrarian and in the foresight of our current generation we planned to develop the additional 15,000
acres and rehabilitate the existing 15,000 acres so as to continue our present productivity and conserve our water resources.
At present, we consume 6.21 acre foot of water per acre farmed as contrasted with the State of Arizona's average of 4.59 acre-foot
per acre farmed. This high water use is due to double cropping of the farmland. In 1973, the average gross production of all
crops grown was $541 per acre. The Salt River Indian Irrigation Project is self-supportive and appropriated moneys are not
budgeted.
The rehabilitation program cost is estimated at $2 million and the construction cost is estimated at $8.7 million. We plan
to complete the rehabilitation program over a period of 10 years so as not to interfere with the income. The development of
the additional 15,000 acres is planned over a 5-year period. Rent income to landowners presently exceeds $600,000. Gross income
from farmland is almost $9 million. The new development will more than double our present agricultural income and as we become
more involved in our own economies, the benefits will quadruple.
You have generously provided $190,000 in the tentative 1975 budget for one-tenth of the estimated rehabilitative costs of
$2 million. This we appreciate. We have generated momentum in our total program, we have immediate demands for the use of
new land and since we have now developed our own capability of earthmoving, we ask your indulgence in the supplemental appropriation
of $2,300,000 to:
One, develop 2,000 acres, 1,358 acres of which was commenced in 1918, but never completed, never farmed. This will form the
basis for a citrus industry in our community. Development will be commenced early in the fiscal year and will cost approximately
$1,170,000.
Two, develop another 2,000 acres for general agriculture on allotted lands. This will be commenced toward the middle of the
year as agreement of the landowners will need to be formalized. The approximate cost is $1,050,000.
And, three, commence development of a 100-acre tract of citrus with 2 to 3 years old planting. The funds requested will be
used to clear and level 4,000 acres, line 50 miles of ditches, drill and equip 21 wells for citrus development and engineering.
Your approval will enhance our agricultural capability, which is our major source of income. We have prepared some graphs
and other data, but in the interest of time copies of these graphs are attached to the information I supplied you. We are
prepared to submit additional data of the figures that you request.
Senator Stevens. We will include the attachments in the record.
[The information follows:]
SALT RIVER RESERVATION CROP REPORT
1971
|
|
|
TOTAL |
TOTAL |
| CROP |
UNITS |
ACRES |
YIELD |
VALUE |
| Fall Lettuce |
Carton |
1,570 |
942,000 |
$ 4,710,000 |
| Spring Lettuce |
Carton |
2,131 |
1,172,050 |
2,930,125 |
| Cotton S/S |
Bale |
3,423 |
5,649 |
1,384,003 |
| Cotton L/S |
Bale |
543 |
214 |
60,990 |
| Barley |
Bu. |
2,087 |
158,612 |
212,540 |
| Watermelons |
CWT |
200 |
35,000 |
127,050 |
| Wheat |
Bu. |
1,182 |
80,376 |
138,247 |
| Sweet Potatoes |
CWT |
151 |
9,060 |
76,557 |
| Potatoes |
CWT |
122 |
34,160 |
93,598 |
| Grain Sorghum |
Bu. |
470 |
34,310 |
45,289 |
| Pasture |
Ac |
547 |
547 |
45,290 |
| Onions |
CWT |
45 |
17,100 |
55,917 |
| Cantaloupe |
Crate |
5 |
500 |
2,000 |
| Silage |
Ton |
36 |
2,520 |
10,080 |
| Alfalfa |
Ton |
711 |
1,351 |
41,471 |
| Sudan |
Ton |
147 |
73.5 |
1,249 |
| Garden |
Ac |
10 |
10 |
1,250 |
|
Totals |
13,380 |
|
$ 9,935,656 |
| Average value per acre of crop |
$ 743 |
| Acres doublecropped |
2,425 |
|
|
| Acres of land |
10,955 |
|
|
| Average value per acre of land |
$ 910 |
|
|
|
TOTAL |
TOTAL |
| CROP |
UNITS |
ACRES |
YIELD |
VALUE |
| Fall Lettuce |
Carton |
1,495 |
835,705 |
$ 2,507,115 |
| Spring Lettuce |
Carton |
2,350 |
1,260,480 |
2,394,912 |
| Cotton S/S |
Bale |
1,489 |
3,352 |
846,427 |
| Cotton L/S |
Bale |
31 |
31 |
8,448 |
| Barley |
Bu. |
1,626 |
120,324 |
181,689 |
| Watermelons |
CWT |
188 |
60,536 |
170,704 |
| Wheat |
CWT |
2,109 |
128,548 |
353,557 |
| Grain Sorghum |
CWT |
2,720 |
121,680 |
337,037 |
| Onions |
CWT |
147 |
83,208 |
399,331 |
| Ensilage |
Ton |
527 |
16,337 |
98,022 |
| Alfalfa |
Ton |
330 |
1,770 |
56,613 |
| Sugar Beets |
Ton |
301 |
7,525 |
97,825 |
| Sugar Beet Seed |
Ton |
55 |
50 |
18,018 |
| Pasture |
Acres |
599 |
|
53,979 |
| Garden |
Acres |
5 |
|
625 |
|
Totals |
13,972 |
|
$ 7,524,302 |
| Average value per acre of crop |
$ 539 |
| Acres doublecropped |
3,533 |
|
|
| Acres of land |
10,439 |
|
|
| Average value per acre of land |
$ 721 |
|
|
|
TOTAL |
TOTAL |
| CROP |
UNITS |
ACRES |
YIELD |
VALUES |
| Fall Lattuce |
Carton |
1,836 |
890,460 |
$ 1,602,828 |
| Spring Lattuce |
Carton |
2,216 |
709,120 |
2,411,008 |
| Cotton S/S |
Bale |
1,130 |
2,656 |
926,944 |
| Cotton L/S |
Bale |
110 |
82.5 |
56,100 |
| Barley |
CWT |
1,091 |
32,730 |
122,737 |
| Wheat |
CWT |
3,169 |
108,390 |
433,560 |
| Grain Sorghum |
CWT |
1,790 |
86,187 |
366,295 |
| Watermelons |
CWT |
98 |
20,384 |
61,152 |
| Onions |
CWT |
284 |
136,400 |
1,009,360 |
| Sugar Beets |
Ton |
1,382 |
36,762 |
631,571 |
| Sugar Beet Seed |
Lb. |
50 |
160,000 |
28,800 |
| Alfalfa |
Ton |
532 |
3,106 |
124,240 |
| Alfalfa Grain Hay |
Ton |
191 |
955 |
37,245 |
| Ensilage |
Ton |
583 |
11,660 |
81,620 |
| Pasture |
Acre |
186 |
|
26,400 |
| Potatoes |
CWT |
65 |
9,750 |
43,875 |
| Garden |
Acre |
5 |
|
625 |
|
Totals |
14,718 |
|
$ 7,964,360 |
| Average value per acre of crop |
$ 541 |
| Acres doublecropped |
3,707 |
|
|
| Acres of land |
11,011 |
|
|
| Average value per acre of land |
$ 723 |
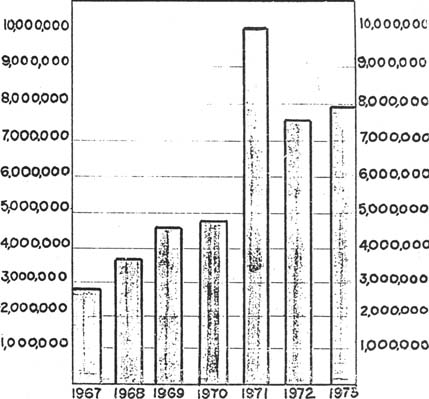
GROSS VALUE OF CROPS GROWN ON THE SALT RIVER PIMA-MARICOPA INDIAN COMMUNITY
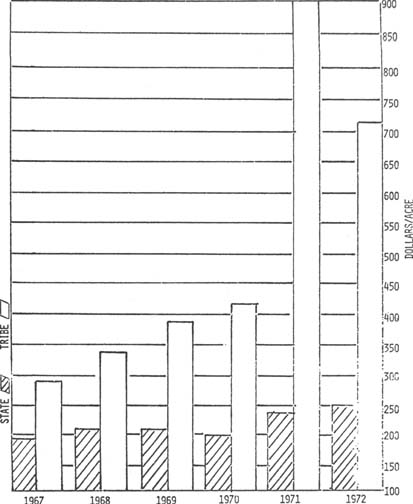
GROSS VALUE OF CROPS/ACRE OF CROPLAND
SALT RIVER PIMA-MARICOPA INDIAN COMMUNITY
SALT RIVER PIMA-MARICOPA INDIAN COMMUNITY
SALT RIVER PIMA-MARICOPA INDIAN COMMUNITY
SALT RIVER PIMA-MARICOPA INDIAN COMMUNITY
Senator Stevens. Thank you very much, Mr. Smith. I looked over the attachments. We are familiar with the Salt River project.
It is one of the earliest we have had. I am interested in one thing. You say gross income from farmland is almost $9 million,
and new development will more than double the agricultural income, of these 15,000 acres. If that is so, why do you need the
additional money?
Mr. Smith. The 15,000 acres is presently developed at $9 million, including 15,000 acres we are farming now. The additional
money is to rehabilitate that 15,000, in addition to that to develop an additional 15,000 acres, for a total of 30,000 developed
acres.
Senator Stevens. From what I know about irrigation projects, it seems that you have a very high income per acre right now.
What I am asking is why isn't the project income sufficient to finance the expansion and rehabilitation?
Mr. Smith. Most of the lands that we are farming are not fully developed. A big portion of that $9 million goes to payment
of leasing of land from our community members by the farmers. About one-third of that $9 million goes itno the payment of
the O. & M. charges, in developing lands that are not fully developed. The remaining portion, of course, is operating expenses
for the farmer; $9 million is for growth.
Senator Stevens. You mean the project pays the farmer for the rent of his land that he farms?
Mr. Smith. The farm enterprise that we have leases the land from the community members, from the allottees of our land, of
which an average of $50 an acre is paid to the individual allottee. The range itself actually starts from $20 an acre to $65
an acre, depending on how well developed the land is. In this process we have a corporation of five members of our community
that own the farm corporation but they subcontract to other farmers, subcontract for specialized products, such as lettuce,
onions, and other staple items that we grow in our community.
Senator Stevens. Is this a project supervised by BIA, Mr. Smith?
Mr. Smith. No. They assist us with some of the technical aspects, but it is not supervised by the BIA.
Senator Stevens. Your corporation is organized under State law, is it?
Mr. Smith. Yes. It is not a tribal corporation. It is a corporation comprised of five of our community members that have gone
into the program. We recently had another community member also go in, so we have two corporations operating in our community,
but they are comprised of our own community members.
Senator Stevens. That was the first Indian reclamation dam, wasn't it, Salt River?
Mr. Smith. I cannot be sure.
Senator Stevens. Thank you very much. We appreciate your statement.
|